I Love NY
Overview
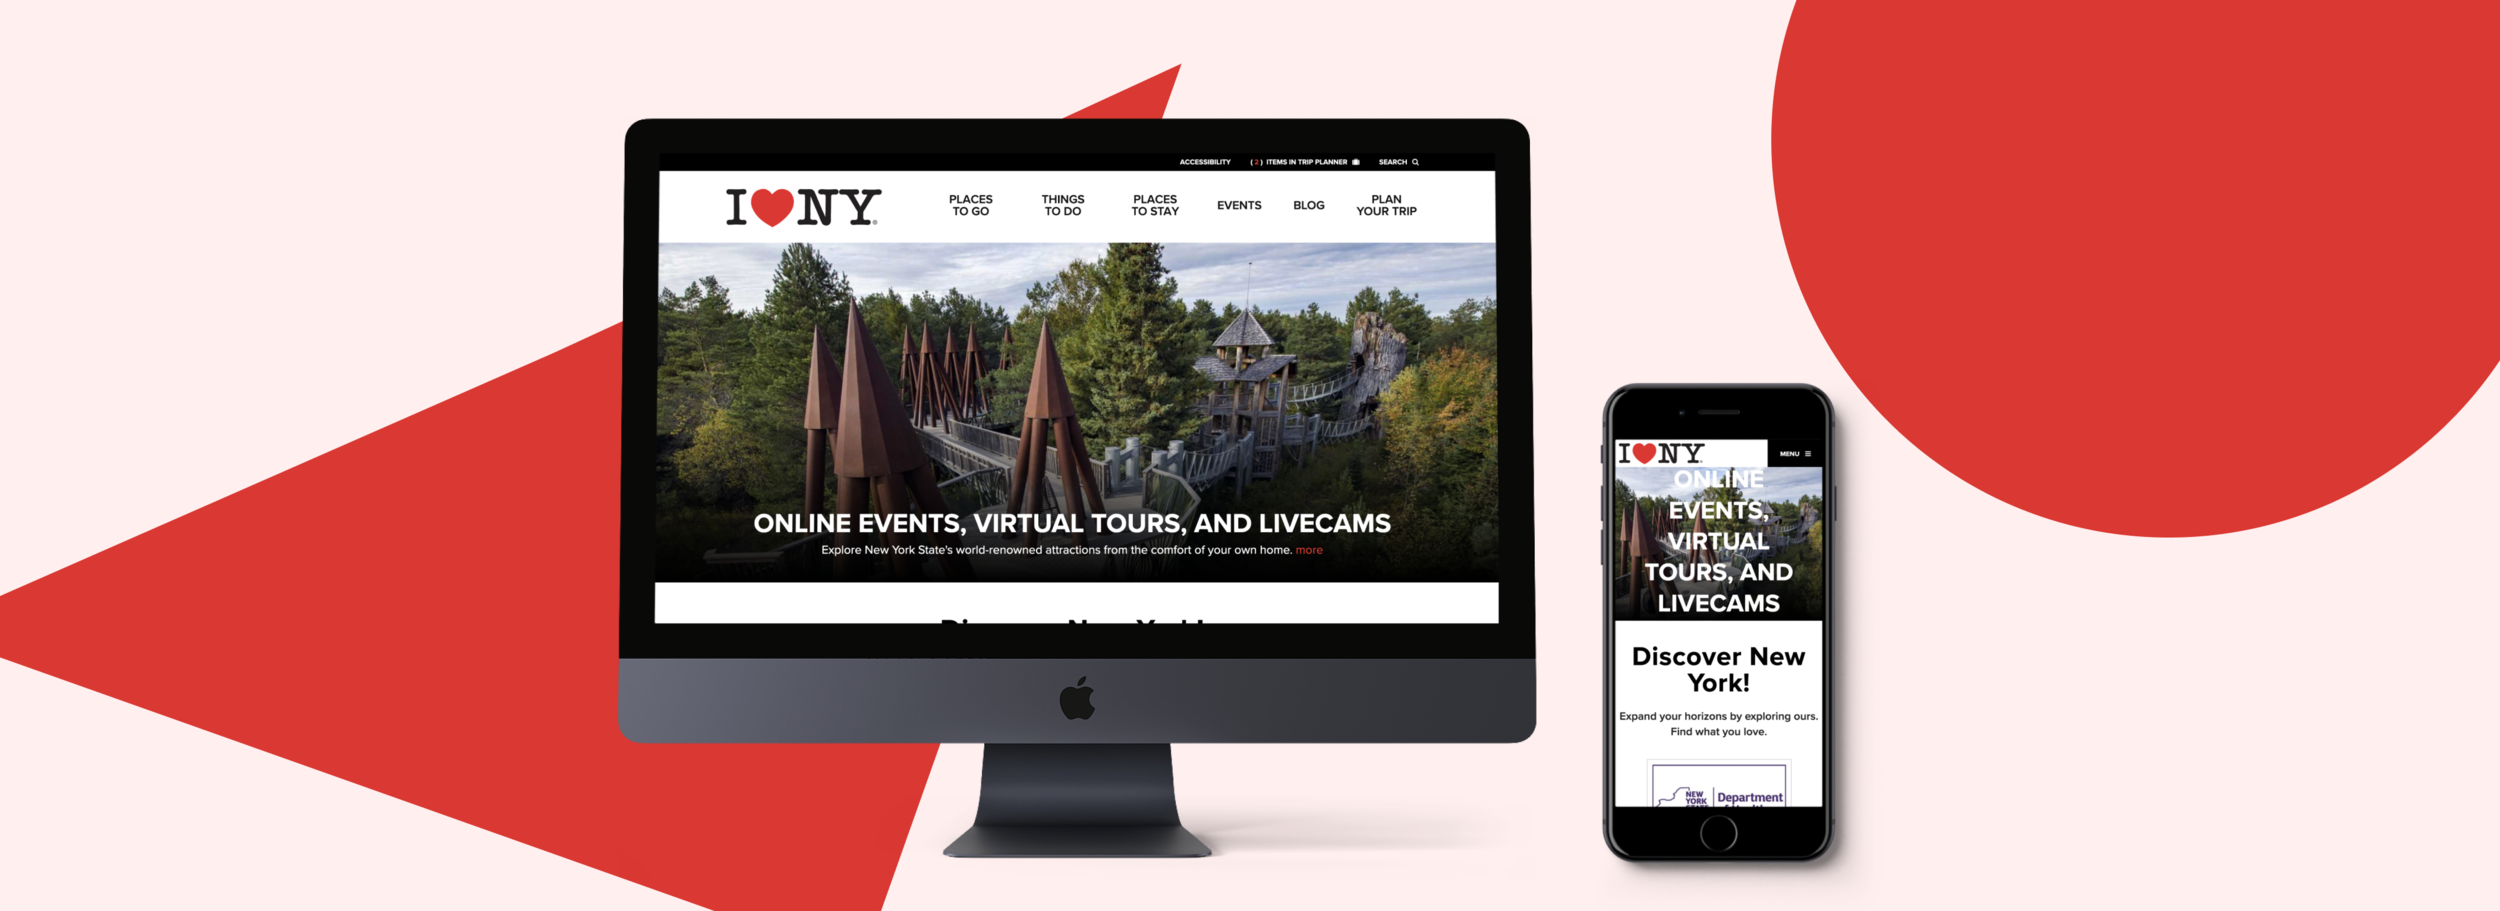
Assessing and redesigning the information architecture of the I Love NY website.
Roles(s)
UX Researcher & Designer
Information Architect
Goal
Gain insight into the mental models of potential NY state tourists and apply findings towards improving the learnability and discoverability of events and activities on the I Love NY website.
The Task at Hand…
In order to accomplish my task I needed perform the following:
Conduct a heuristic evaluation
Create a sitemap
Conduct one round of an open card sort (5 participants)
Document a user flow
Conduct one round of a closed card sort (5 participants)
Create a final sitemap
Sam is the persona to keep in mind during this process.
Assessing the Existing Site
Heuristic Evaluation
Assessment for the current state of the I Love NY website was done by utilizing the Abby Method guidelines for information architecture heuristic evaluation.
My initial surface level impressions of the website were relatively positive in all categories. Minor issues were mainly centered around discrepancies in behavior between mobile and desktop viewports.
Brief Summary of Heuristic Findings
Sitemap
I went onto mapping out the existing site structure focusing on the primary and secondary navigation. I quickly arranged a map in Sketch in order to get an overview of the current site-wide nav.
Initial Sitemap
What stood out to me immediately was that on the I Love NY website under both the ‘Things to do’ and ‘Events’ primary navigation, there exists pages with the same names (e.g. Nature, History, Food & Drink, Arts & Culture).
Initially I took them for duplicate page links but upon deeper examination, they turned out to be two different pages with different functionalities.
Open Card Sorting
Despite sharing similar appearances, the pages under ‘/things-to-do/’ lacked a timeframe which was what set them apart from the pages under ‘/events/’. Thus, ‘things-to-do/nature/’ offered more of a generalized collection of different nature activities whereas ‘/events/nature’ contained information pertaining to specific time-sensitive events related to nature.
When devising the open card sort I needed to clearly distinguish the repeat page names as to avoid having participants keyword match similar sounding pages and deliberately group together events and activities.
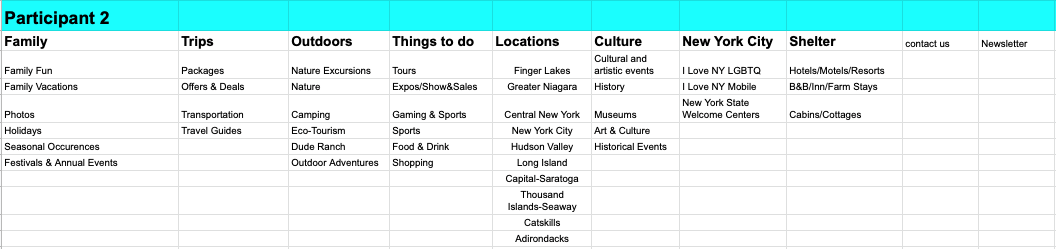
Participant 2 Card Sort Categories
Analysis
Every participant had their own unique take on how the information was to be categorized. There were a couple of recurring patterns that I slowly identified across the card sorts.
Identified Trends:
Grouping of culture and history activities/events
NY regions were often grouped in the same category
Prevalence of an outdoors or nature category with activities and events associated with the outdoors
Confusion over where to have the contact info or newsletter
Tendency to see trip planning grouped with transportation as well as housing
From these patterns in the data I derived six categories to be tested in a round of closed card sorting.
New Categories:
Location — targeted at the frequency in which regions of NY are grouped together
Culture — To reflect the high number of activities/events associated with NY culture
Outdoors — Based on the frequency of occurrence in the data.
Events — To contain the nav items that don’t immediately fall under culture and outdoors
Travel Planning — Aimed at containing everything related to the logistics of planning a trip
More Info — A section to primarily handle certain common outliers
Closed Card Sorting
With the categories determined for the closed card sort, I needed to recruit participants.
Guerrilla + Snowball Sampling
Due to time constraints and a lack of easily accessible leads or participants to conduct the study with, I employed guerrilla sampling at my local university in order to recruit participants to take part in the closed card sort.

Snowball sampling naturally took place with the help of using a snack as an incentive
Revised Site Map
The revised site map was constructed based on the most common trends seen in the closed card sorting activity.
Key Takeaways
The short amount of research done in this sprint seem to have indicated that there is some favorability towards these newly defined categories albeit with a small sampling size.
I should’ve made a better distinction between the naming of duplicate events and activities prior to card sorting.
Most of my data synthesis was done manually and there definitely exist more efficient techniques or software out there to facilitate the task.
Ultimately when it comes down to the actual usability of the revised site structure, there’s no way of determining whether or not it really is an improvement without conducting further testing and iteration.